前回5月と6月前半の降水量について意外な結果が出たので友人に聞いたところ5月と6月前半だと5月の方が雨が少ないと思っているようだったのでその原因を考えたい。
- 仮説1: 6月後半から梅雨に入るのでそのイメージが強すぎる
- 仮説2: 実際5月にはひどく雨が降る日がなく、降ったことになっていない
- 仮説3: 6月のほうが湿度は高く、今にも雨が降りそうでただ降っていない
を考えた。今回は仮説2を降水量の分布と外れ値について調べてみる。
とりあえず1995/4/17から2014/4/17の大津市のデータで下調べをすると、
1月 max= 53 rainy= 0.307 mean= 1.702
1月 max= 43 rainy= 0.317 mean= 1.764
2月 max= 35 rainy= 0.469 mean= 2.154
2月 max= 47 rainy= 0.527 mean= 3.367
3月 max= 43 rainy= 0.557 mean= 3.744
3月 max= 41 rainy= 0.652 mean= 3.965
4月 max= 64 rainy= 0.497 mean= 3.823
4月 max= 57 rainy= 0.578 mean= 3.535
5月 max= 143 rainy= 0.508 mean= 5.911
5月 max= 126 rainy= 0.617 mean= 5.368
6月 max= 56 rainy= 0.484 mean= 3.97
6月 max= 154 rainy= 1.127 mean= 10.258
7月 max= 94 rainy= 0.9 mean= 8.765
7月 max= 131 rainy= 0.462 mean= 5.401
8月 max= 106 rainy= 0.383 mean= 3.847
8月 max= 100 rainy= 0.505 mean= 5.296
9月 max= 170 rainy= 0.57 mean= 5.395
9月 max= 157 rainy= 0.541 mean= 6.128
10月 max= 75 rainy= 0.477 mean= 4.626
10月 max= 110 rainy= 0.382 mean= 4.243
11月 max= 67 rainy= 0.39 mean= 2.967
11月 max= 56 rainy= 0.319 mean= 2.542
12月 max= 40 rainy= 0.338 mean= 1.919
12月 max= 45 rainy= 0.345 mean= 1.824
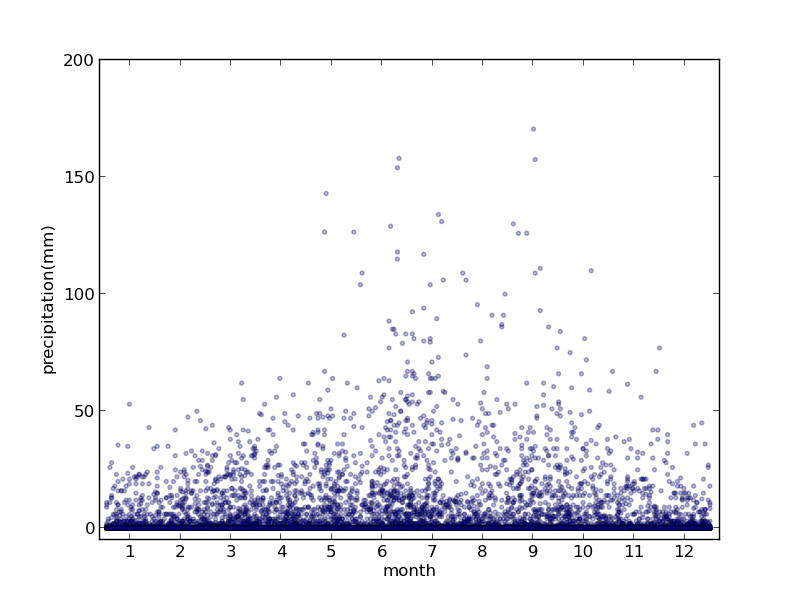
5月も降る日は降っている。外れ値の可能性もあるので一度散布図を描いてみる。今回は1985/4/22から2014/4/22のデータに増やしてみた。
# -*- coding: utf-8 -*-

from __future__ import division
import csv
import numpy as np
import matplotlib.pyplot as plt

#used just to correct data on month
month_have_days = np.array([31, 28, 31, 30, 31, 30, 31, 31, 30, 31, 30, 31])
X = np.empty((10593, 1), dtype=np.float32) #month + date/month_have_days
Y = np.empty((10593, 1), dtype=np.float32) #rain

with open('shiga-rain2.csv','r') as csvfile:
    csvreader = csv.reader(csvfile)
    for ncol, row in enumerate(csvreader):
        #remove the headers and skip the date if nodata
        if ncol < 5 or row[1] == '': continue
        month, date, rain = int(row[0].split('/')[1]),\
                            int(row[0].split('/')[2]),\
                            float(row[1])

        #skip the last feb. day of leap year
        if date > month_have_days[month-1]: continue
        X[ncol-6] = month + date/month_have_days[month-1]
        Y[ncol-6] = rain

#1. Figureインスタンスの生成
fig = plt.figure()
#2. Axesインスタンスの生成
ax = fig.add_subplot(111)
#3. プロット
ax.scatter(X, Y, s=8, c='b', alpha=.3)
#4. 軸の範囲を設定
ax.set_xlim(0.9,13.2)
ax.set_ylim(-5,)
#5. 軸のラベルを設定
ax.set_xlabel('month')
ax.set_ylabel('precipitation(mm)')
#6. 軸の目盛りを設定
ax.set_xticks(np.arange(1, 13)+0.5)
ax.set_xticklabels(range(1,13))

plt.savefig('test.png')

分布はこんな感じになった。これを見た感じでは外れ値を除いても6月の前半の方が降っていないように見える。第2章はPMF、相対危険度、条件付き確率についても勉強しないといけないのでちょっとここで撤退。