RのsurvivalパッケージにあるcolonはStage B/Cの結腸癌患者を対象とした術後補助化学療法の比較臨床試験データ。pythonを使ってこのデータの生存時間解析をやってみる。まずは可視化から。
colon.csvの様子
id,study,rx,sex,age,obstruct,perfor,adhere,nodes,status,differ,extent,surg,node4,time,etype
1,1,Lev+5FU,1,43,0,0,0,5,1,2,3,0,1,1521,2
1,1,Lev+5FU,1,43,0,0,0,5,1,2,3,0,1,968,1
2,1,Lev+5FU,1,63,0,0,0,1,0,2,3,0,0,3087,2
2,1,Lev+5FU,1,63,0,0,0,1,0,2,3,0,0,3087,1
3,1,Obs,0,71,0,0,1,7,1,2,2,0,1,963,2
3,1,Obs,0,71,0,0,1,7,1,2,2,0,1,542,1
4,1,Lev+5FU,0,66,1,0,0,6,1,2,3,1,1,293,2
4,1,Lev+5FU,0,66,1,0,0,6,1,2,3,1,1,245,1
5,1,Obs,1,69,0,0,0,22,1,2,3,1,1,659,2
とりあえずそれぞれプロットしてみる。データ処理はpandasでゴリ押ししたかったが触り始めたばかりなので最初の方だけ。
from __future__ import division
import numpy as np
import pandas as pd
import matplotlib.pyplot as plt

#read data
colon = pd.read_csv('colon.txt')

mask = np.array([i == 2 for i in colon.etype])
cd = colon[mask][['rx','time']]

lev = np.array(cd[[i == 'Lev' for i in cd.rx]].time)
lev5fu = np.array(cd[[i == 'Lev+5FU' for i in cd.rx]].time)
obs = np.array(cd[[i == 'Obs' for i in cd.rx]].time)

#plot
def survival_function(arr):
    return [1 - i/len(arr) for i in range(len(arr))]

fig = plt.figure()
ax = fig.add_subplot(111)

ax.set_xlabel('days')
ax.set_ylabel('survival_function')
for arr, name in zip((lev, lev5fu, obs),('Lev', 'Lev+5FU', 'Obs')):
    ax.plot(np.sort(arr), survival_function(arr), label=name)
ax.legend(['Lev', 'Lev+5FU', 'Obs'])
plt.show()

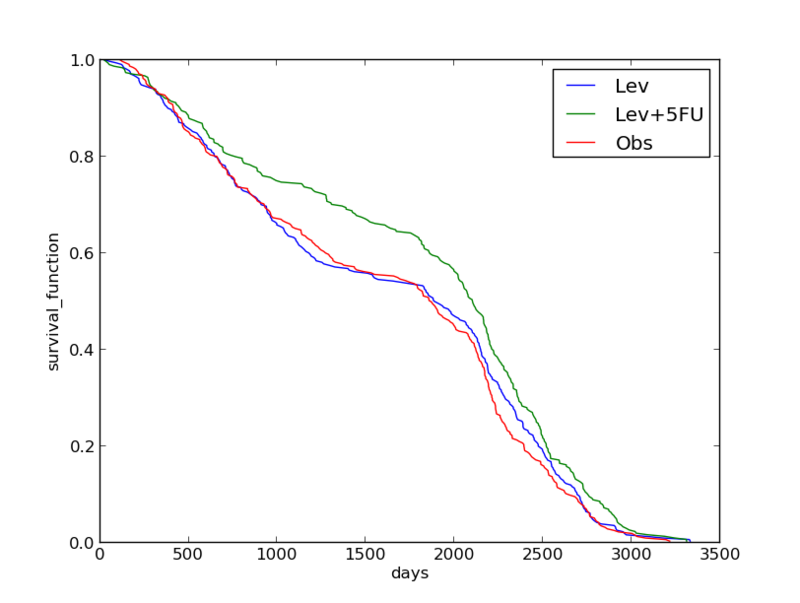
Levamisole + 5-FUの結果が良さそう。
PMF(probability mass function: 確率質量関数)とCDF(cumulative distribution function:累積分布関数)
確率質量関数(pmf)は正規化されたヒストグラムのことを指す。今回はまず死亡するまでの日数のヒストグラムを考え、さらにこれを正規化することにする。累積分布関数(cdf)はpmfをパーセンタイル順位に対応させたもの。
- numpy.histogramを使った場合
テキストにはnp.histogramの引数にnormedを使っているがこれはnumpy2.0で廃止予定の機能らしいのでdensityを使う。densityだと面積の和が1になるように密度を返してくる。今回はそれぞれのビンごとの和が1になればいいので\(\rm \overline{pdf}\)を求めてからpmfにビンの幅を掛けて変換する。cdfはpmfのcumsumで求める。
#plot pmf
fig = plt.figure()
ax_hist = fig.add_subplot(311)
ax_pmf = fig.add_subplot(312)
ax_cdf = fig.add_subplot(313)

ax_hist.set_ylabel('hist')
ax_pmf.set_ylabel('pmf')
ax_pmf.tick_params(labelbottom='off')
ax_cdf.set_ylabel('cdf')
ax_cdf.set_xlabel('days')

for i, arr in enumerate([lev, lev5fu, obs]):
    #histogram
    hist, bin_edges = np.histogram(arr, bins=35, range=(0,3500))
    #pmf, cdf
    pdf, bin_edges = np.histogram(arr, bins=35, range=(0,3500), density=True)
    pmf = pdf*100
    cdf = np.cumsum(pmf)

    #define width of bars(== range[1]/bins/3)
    width = bin_edges[-1]/105

    ax_hist.bar(bin_edges[:-1]+i*width, hist, width=width, color=str(i/4))
    ax_hist.legend(['Lev', 'Lev+5FU', 'Obs'])
    ax_pmf.bar(bin_edges[:-1]+i*width, pmf, width=width, color=str(i/4))
    ax_cdf.bar(bin_edges[:-1]+i*width, cdf, width=width, color=str(i/4))

plt.show()

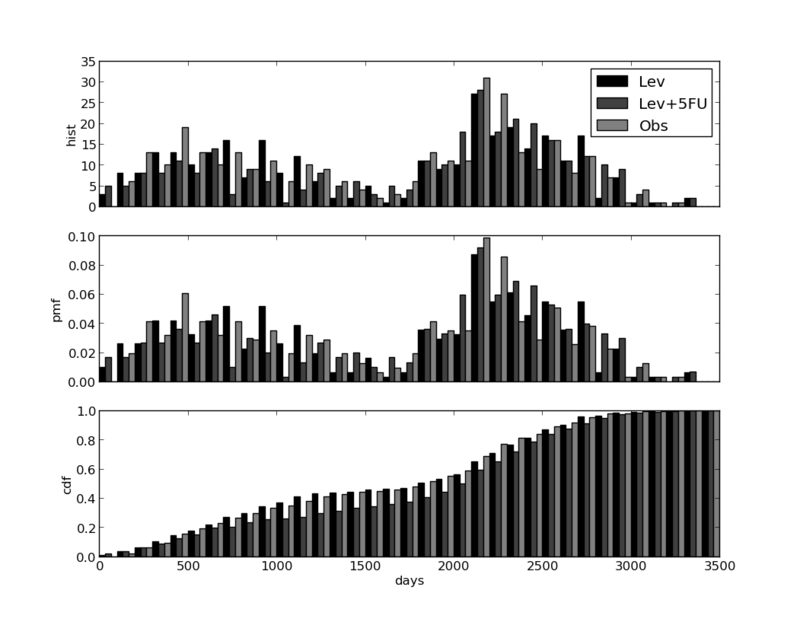
これは分かりにくい。pmfは二峰性らしい。
- matplotlib.pyplot.histを使う場合
np.histogramの場合と同様、pmfを求める際にはnormed=Trueではなく、weightsを設定する必要がある。
for i, arr in enumerate([lev, lev5fu, obs]):
    #histogram
    hist, bin_edges = np.histogram(arr, bins=35, range=(0,3500))
    #define width of bars(== range[1]/bins/3)
    width = bin_edges[-1]/105
    ax_hist.bar(bin_edges[:-1]+i*width, hist, width=width, color=str(i/4))
    ax_hist.legend(['Lev', 'Lev+5FU', 'Obs'])

    #pmf
    ax_pmf.hist(arr, bins=50, range=(0,3500), weights=np.array([1/len(arr)]*len(arr)), histtype='step', color=('b','g','r')[i])
    ax_pmf.legend(['Lev', 'Lev+5FU', 'Obs'])
    #cdf
    ax_cdf.hist(arr, bins=100, range=(0,3500), normed=True, cumulative=True, histtype='step', color=('b','g','r')[i])

plt.show()

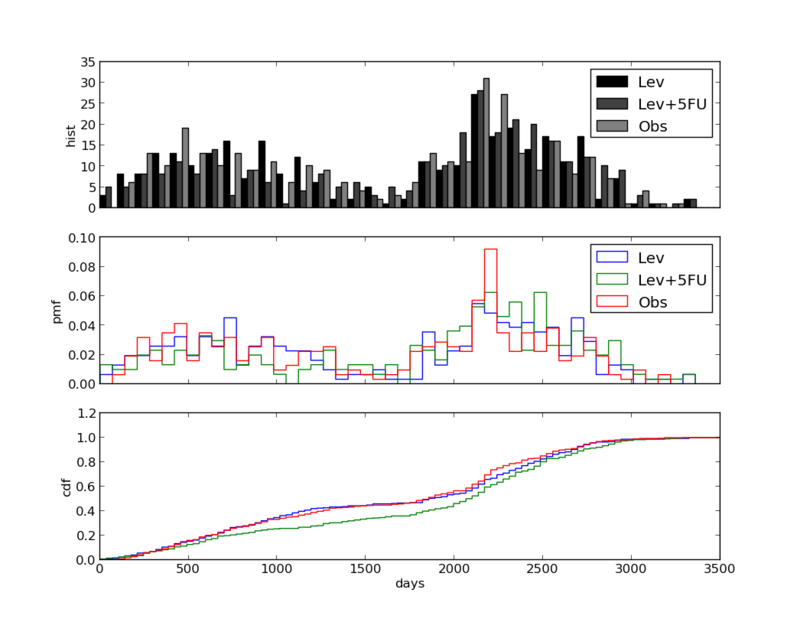
そもそもpmfは今回のような標本数の多いケースでは可視化に向いていないことが分かる。